“Beware the Ides of March”
Global share markets opened the new year with mild optimism that inflation and interest rate risks were becoming more manageable and economic activity was improving. However, a sequence of financial shocks in March – the sudden US bank collapses (Silvergate, Silicon Valley and Signature) and Credit Suisse woes – have dented this optimism. Bank share prices across the world have fallen sharply as investors worry “who might be next” to fail. Bond markets have experienced dramatic shifts in yields as they weigh up bank stability concerns against inflation risks. Central banks confront a major dilemma – do they risk further bank failures and a credit crunch for the global economy by raising interest rates further or do they risk inflation remaining high and the ‘cost of living’ crisis continues. The last three years since March 2020 when the pandemic was officially declared have proven to be a rollercoaster. We seem to be still living in a fragile and volatile world.

Yet bank failures are ‘nothing new under the sun’. A bank’s role of taking short term deposits and providing long term loans to business and consumers generates significant credit and interest rate risks. When banks fail there are the usual suspects such as poor decision making, lack of diversification and the failure to manage risks. However, an additional challenge is added when there are many bank failures because depositors and shareholders tend to panic. ‘Contagion’ could see even a cautious and prudent bank facing ruin as occurred in Australia in the 1890s, the World in Depression in the 1930s and the Global Financial Crisis “GFC” from 2007-2009.
Are we confronting this today? By comparison to 2008, the current financial turbulence appears a milder version. As shown in charts 1 and 2 below, the falls in the Australian and US share indices in 2008 were much more dramatic than the current experience. Notably in 2008, the KBW US bank index fell by -60% compared to this year’s fall of -22%. Given the significant increase in global bank capital levels and regulatory scrutiny over the past decade, there are reasons for optimism that another ‘global financial crisis’ is unlikely to be repeated. However, banks still need to be transparent about their credit and interest rates risks and may need to raise their capital levels to provide assurance to investors.
Charts 1 and 2 – Change in global shares
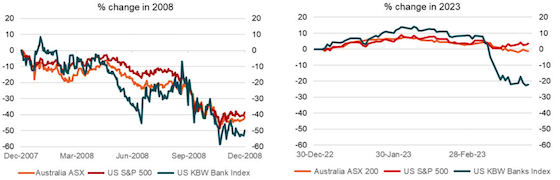
Source: Refinitiv.
Are there any positive signs amidst this turmoil?
Global economic activity appears to have improved in the opening months of the year. Europe’s warmer weather has mitigated the energy price crunch while the remarkable strength in America’s jobs market and retail spending have provided positive surprises. China’s activity has also revived with the end of the national government’s ‘Zero COVID’ strategy of lockdowns with virus outbreaks. Global business surveys such as Purchasing Manager’s Indexes (PMIs) have made some encouraging gains in recent months.
Global consumer inflation appears to be finally moderating. Inflation has clearly peaked in the United States with 6% annual inflation in February compared to 9.1% in June 2022, as shown in chart 3 below. European inflation is starting to decline with lower energy prices after a warmer winter. Chinese inflation has remained constrained at 1% given a subdued economy struggling with a weak property sector. Australia’s inflation was 7.4% in January according to the new monthly measure which is notably below the 8.4% result in December. However rising rents and expected sharp rises in electricity prices from mid-year onwards suggests that Australia’s inflation is likely to remain elevated and painful this year.
Chart 3 – Global consumer inflation
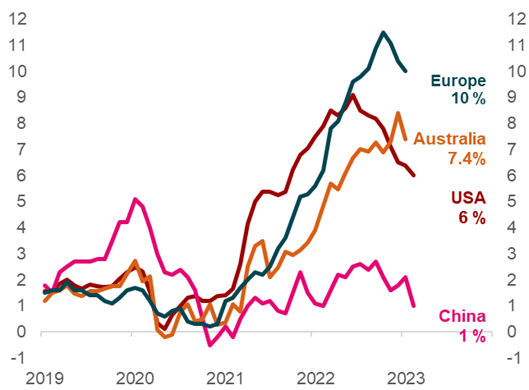
Source: ABS, Eurostats, China National Bureau of Statistics and US Bureau of Labor Statistics.
Commodity price pressures are fading as evidenced by lower global oil prices in recent months. The Brent crude oil price has fallen back from US$129 per barrel in June 2022 to currently US$75 as shown in chart 4 below. Given this oil price is measured in US Dollars, the Australian consumer has not as yet seen the benefit of lower oil prices due to a weaker Australian currency over that period. While we all contend with a retail petrol price stuck around the $2per litre level, the relief is that petrol prices are no longer continuing to rise. This means that inflation pressure should abate over time. Some comfort can also be taken from the recent sharp falls in shipping costs which indicates that global supply chain disruptions are being resolved. This also suggests global inflation pressures should moderate.
Chart 4 – Oil prices v’s shipping costs
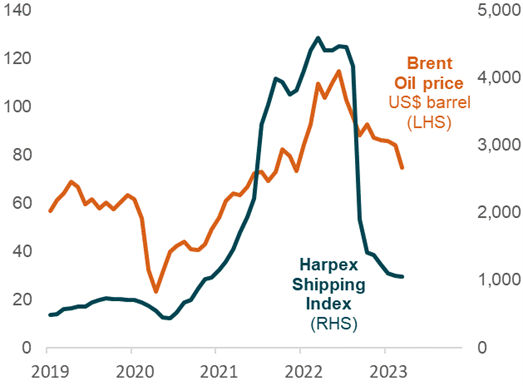
Source: Refinitiv.
Yet why are central banks still raising interest rates?
Central banks responded to high inflation over the past year by rapidly raising official interest rates, as shown in chart 5 below. The Federal Reserve (FED) raised the US cash interest rate by a further 0.25% in March to a new target range of 4.75% to 5% even with the banking turmoil. The European Central Bank (ECB) raised their key interest rate by 0.5% in March even though the problems of Switzerland’s second largest bank in Credit Suisse are right on their doorstep. The Reserve Bank of Australia (RBA) increased the cash interest rate by 0.25% to 3.6% in March.
Chart 5 – Central bank official interest rates
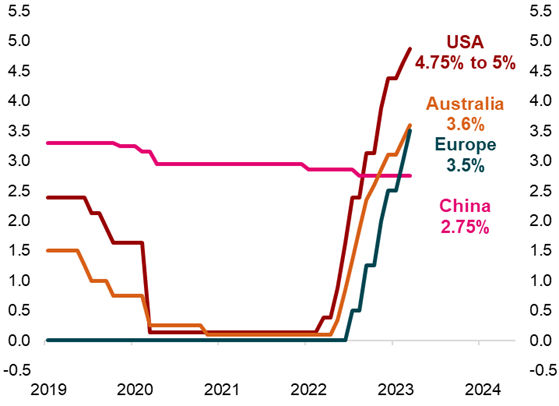
Source: RBA Statistical Table – F13.
Central banks still view inflation as a ‘clear and present danger’. There are a few reasons for this inflation obsession. Firstly, central banks proved complacent about the inflation risk in 2021 and early 2022 by arguing that price pressures were ‘transitory’. The strong recovery in global demand given low interest rates and government stimulus combined with the arrival of vaccines, were seen as a temporary boost to inflation. Secondly the inflation risks accelerated last year with the tragic Russia-Ukraine War and the persistence of global supply chain problems. So, inflation has remained well above central bank’s annual inflation targets which are typically 2%. Central banks consider their credibility is being questioned by not meeting these inflation targets.
Also, troubling central bankers are persistent price pressures in residential rents and wages as illustrated in charts 6 and 7 below. Residential rents are surging at an 8.8% annual pace in the United States given higher mortgage costs for landlords and low vacancy levels. Australia is now seeing strong rental increases at 4.8% in the year to December according to the official Australian Bureau of Statistics (ABS) inflation data. However, the anecdotal evidence from new renters is even more dramatic by suggesting that Australia’s rents are increasing at an 10% annualised pace.
Chart 6 and 7 – Residential rents and Wages growth
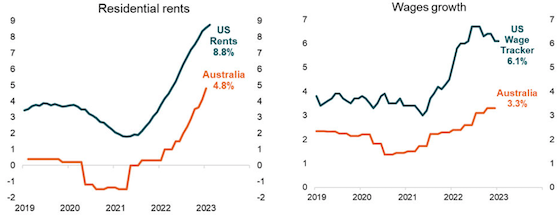
Source: ABS and US Bureau of Labor Statistics for residential rents and wages. Federal Reserve Atlanta for the US wage tracker.
Notably US wages growth shows a sharp surge to above 6% given a shortage of available workers. Australian wages growth has been milder at 3.3% in the year to December 2022, but again anecdotal evidence suggests that pressures are building. These wages pressures reflect the difficulty in attracting and retaining workers given the current shortages. This worker shortage reflects a mix of factors such as early retirement, lower immigration and the difficulty in getting affordable childcare.
Central bankers consider that labour markets are “tight” as there are high job vacancies outstanding with low unemployment levels. The ratio of job vacancies relative to the level of unemployed is 0.9 in Australia compared to the 1.9 in the USA as shown in chart 8 below. Both the Australian and American central banks are worrying that employees now have more bargaining power to push for higher wages to compensate for the recent inflation surge. Central banks feel that they have no choice but to slow economic activity and the demand for labour to cool inflation pressures. Accordingly, central bankers still feel compelled to act and talk tough by raising interest rates.
Chart 8 – Job vacancies to unemployment ratio
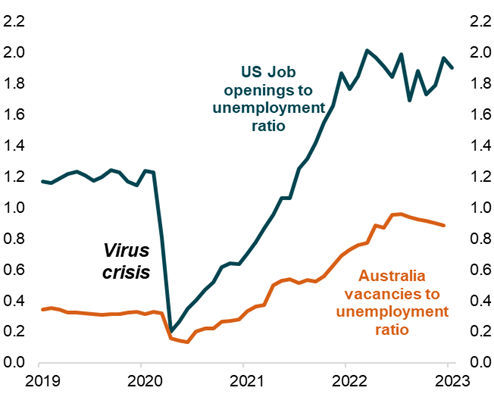
Source: ABS, Federal Reserve St Louis and US Bureau of Labor Statistics.
Diversification is the best defence given the contingencies and possibilities
The recent global banking turmoil is another worry that has been added to the troubling trio of high inflation, rising interest rates and the war in Ukraine over the past year. For investors, assessing these considerable risks is challenging. Given the current investment climate is contingent with multiple positive and negative scenarios possible, investors should maintain a disciplined and diversified strategy to manage these extraordinary risks.
Important information and disclaimer
This article has been prepared by NULIS Nominees (Australia) Limited ABN 80 008 515 633 AFSL 236465 (NULIS) as trustee of the MLC Super Fund ABN 70 732 426 024. The information in this article is current as at June 2021 but may cease to be accurate in the future.
NULIS is part of the group of companies comprising IOOF Holdings Ltd ABN 49 100 103 722 and its related bodies corporate (IOOF Group).
Opinions constitute our judgement at the time of preparation. In some cases information has been provided to us by third parties and while that information is believed to be accurate and reliable, its accuracy is not guaranteed in any way.
To the extent that the information in this article is or contains advice, it does not take into account any particular person’s objectives, financial situation or needs. Before acting on the information, you should consider the relevant Product Disclosure Statement, consider the product’s appropriateness to you having regard to your personal objectives, financial situation and needs, and consider obtaining independent advice. The Product Disclosure Statement for the MLC Super Fund is available at https://www.mlc.com.au/personal/superannuation/products or can be obtained by calling 132 652 (Monday to Friday between 8am and 6pm AEST/AEDT). Returns are not guaranteed and past performance is not a reliable indicator of future performance. The value of an investment may rise or fall with the changes in the market. You should not rely on this article to determine your personal tax obligations. Please consult a registered tax agent for this purpose. Subject to terms implied by law and which cannot be excluded, neither NULIS nor any member of the IOOF Group accepts responsibility for any loss or liability incurred by you in respect of any error, omission or misrepresentation in the information in this communication.